The SBOBU Economic Index
by David Dvorkin
-
What do economists know about the economy? And if they do know, how much are they really telling us? SBOBU has the answers! Maybe.
In July 2003, I was laid off from my job as a Web developer at InfoNow Corporation in Denver.
I really liked the company and my coworkers, and I was planning to stay there for the rest of my career. The layoff came as a shock and cast me into a deep depression. After a while, that gave way to healthy and restorative anger. I wrote a bitter, sarcastic essay, "The Surprising Benefits of Being Unemployed", and put it on our Web site.
Two things happened as a result of that link that I had not foreseen.
The first was that someone mentioned my essay on Slashdot, the premier online site for geeks, and included a link to the essay. No doubt, many of the geeks who read Slashdot were worrying about their own jobs, since that was the time of the Great Dot Com Bubble Deflation, so vast numbers of them clicked on that link and read my essay. A lot of them must have told their friends about it, too. During the next couple of weeks, the essay was clicked on about 115,000 times, by people from all over the world. I got hundreds of e-mails, also from all over the world, and a few possible job leads. None of the job leads panned out, but they certainly did wonders for my mood at a time when I needed a lift.
Some of the e-mails were hostile, coming from people who resented the political slant of my essay and who blamed me for my job loss. The majority of the e-mails were sympathetic, though. Many of those came from people who had lost their own jobs or were about to and who expressed sympathy and understanding. Many of those people said that the humor and anger in my essay had helped them deal with their own job loss. That was a surprise to me, and a pleasant one.
That brings me to the second of the two unexpected results I mentioned above.
Even though the initial flood of hits on the essay and e-mails as a result of the Slashdot link died down, hits and e-mails continued to come on a reduced level. I still get a few e-mails a month from people who are unemployed and who chanced across my essay while searching the Web for information about being unemployed and about job hunting. The e-mails run the gamut - touching, funny, humorous, warm, friendly, heartbreaking. I answer each one, of course, expressing appreciation to those who thank me for my essay and trying to be helpful to those who need a helpful voice. In a way, I find myself playing the role of Ann Landers for the joblorn, and I can only hope that my e-mail replies really are helpful rather than hurtful or - my constant fear - somehow harmful.
My ISP doesn't give me access to Web server logs, but it does give me a monthly summary of hits on the files on my site. Watching the monthly total of hits on the unemployment essay, I began to get the feeling that the rise and fall of that number was an indication of the real state of the national economy.
Oh, yeah, we get numbers every month from Washington. Right now, given the kind of people who control our government, who believes those numbers? I strongly suspect that the number of people who are searching the Web for information about being unemployed and who read my unemployment essay as a result are a more accurate reflection of the real rise and fall of unemployment.
And so I have decided to call the number of hits the Surprising Benefits of Being Unemployed Economic Index, or SBOBU for convenience.
Here's a chart of the actual number of hits on the essay, starting in September 2003, when I posted it and Slashdot discovered it:
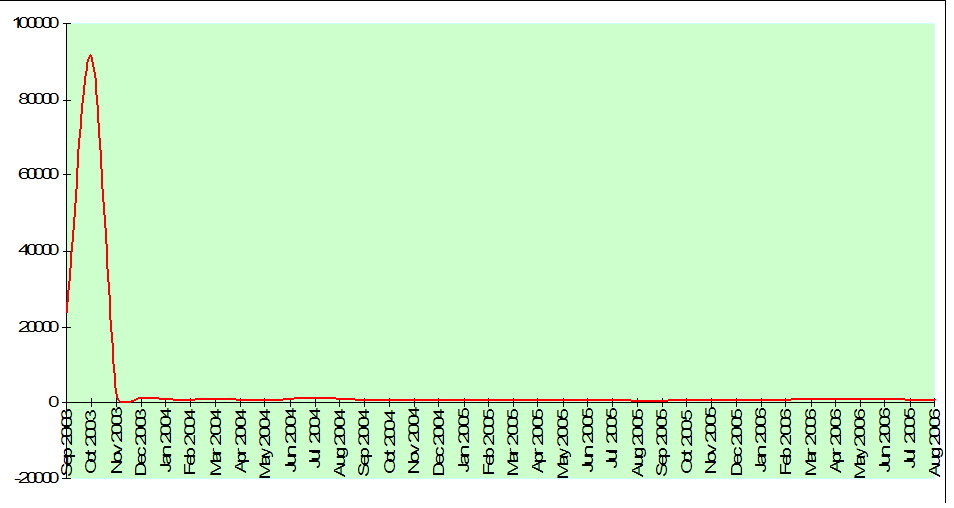
Click on the graph to see a larger version (which opens in a separate window).
Obviously, the Slashdot hits distort the picture. So instead, I graphed the hits starting with January 2004. For comparison purposes, I put the official seasonally adjusted monthly unemployment numbers from the Bureau of Labor Statistics on the same graph. The BLS numbers are in thousands, and I further "normalized" them by dividing by 8. My numbers are in appropriately alarming red, while the BLS ones are a misleadingly optimistic green.
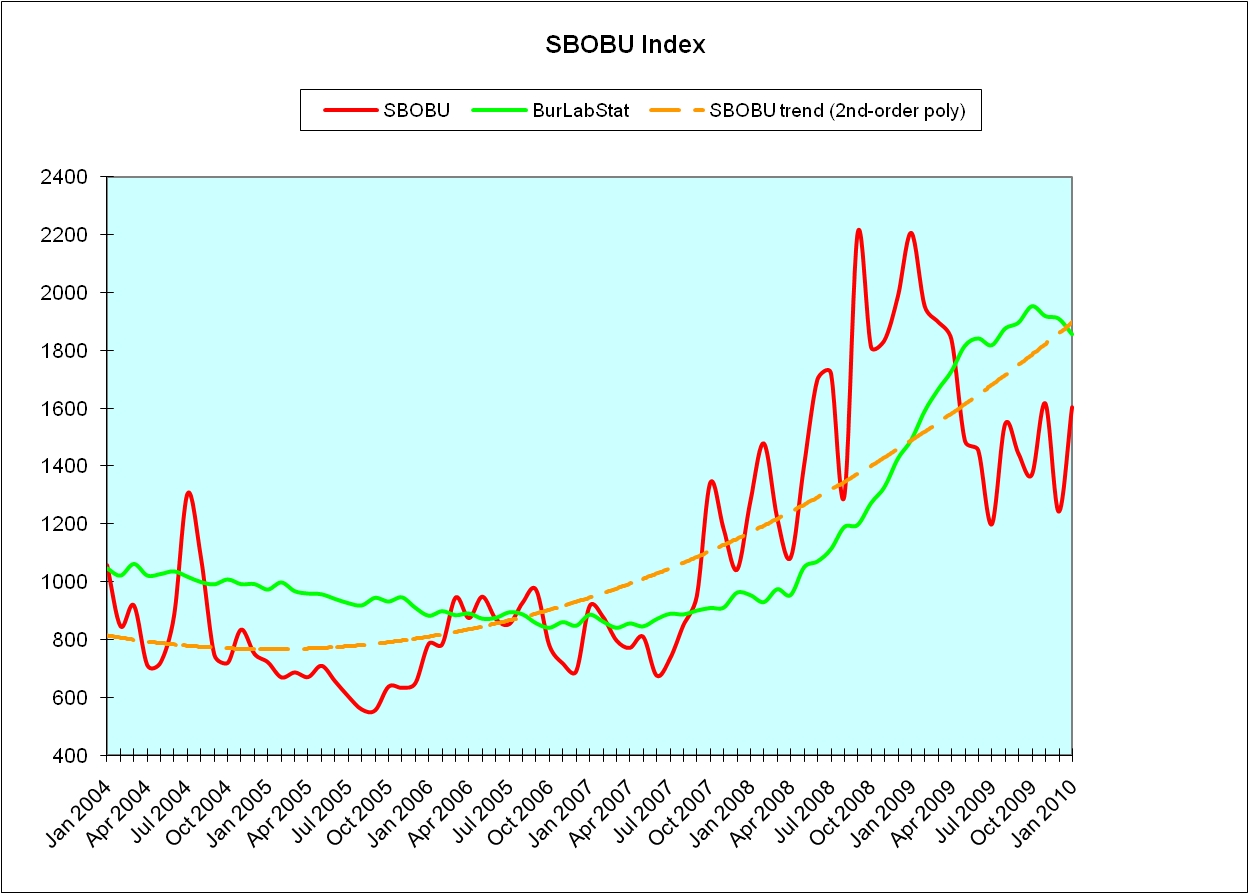
Click on the graph to see a larger version (which opens in a separate window).
Ignore the July 2004 peak. I probably posted a link to the essay somewhere online, resulting in another distortion.
Note: The next three paragraphs were written when I first created this page, right after the August 2006 numbers became available. Note how the government numbers show a nice, slow, steady decline in monthly unemployment from the Dotcom Bust peak. There's a little uptick at the end, but nothing alarming yet. But every worker in America knows that that doesn't represent reality.
The red line, however, the SBOBU Index line, which is not adjusted for the season or because of orders from the White House, shows a different picture, one that corresponds surprisingly well to anecdotal reports from acquaintances about their employment experiences. SBOBU says that unemployment did indeed decline from its peak around the end of 2003, but the decline stopped in the summer of 2005 and it has been climbing steeply since then. I'll update these charts as the new monthly numbers become available. The results should be instructive and could well be alarming, perhaps even cause for utter panic, screaming, and running madly in circles.
Because, unlike our current government, SBOBU doesn't lie.
September 2006 Update
I've updated the above graph to include the September 2006 numbers.
The disconnect between the two trends became more exaggerated during September. The government says the employment situation is booming. Real people say the employment situation sucks. The green line is trending down, while the red one trends up. The SBOBU index agrees with the real people.
October 2006 Update
I've updated the above graph to include the October 2006 numbers.
Good Heavens! The previous disconnect has suddenly disappeared! SBOBU sez that the job situation really is improving!
It could also be that the oscillations in the SBOBU index are increasing in amplititude, with even greater upturns to come. Or it could be that the unemployed people who would otherwise have been hitting the unemployment essay page were instead invigorated and filled with optimism by the hopes of a Democratic victory in the midterm election that was still in the future when these data were gathered. We know now that optimism about the elections was justified; let's hope that any associated optimism about the effects on the job market was also justified.
Best to wait and see what happens during the coming months.
January 2007 Update
I had intended to do this every month, but since the signifance of these graphs is, um, lacking in rigorously supportable claims of significance, there's no point in overdoing it.
Okay, I've updated the above graph to include the November '06 through January '07 numbers.
Interestingly, the official numbers started trending upward again in November. Taking into account the lies about the economy of the Bush people, that must mean that the real numbers are trending up sharply. Which is what the SBOBU index shows in January. This is a disturbing way to start the year.
July 2007 Update
So that's two quarters under the belt. The official numbers are starting to trend up gradually, while SBOBU, after oscillating wildly, is dropping. I can't pretend to know what this means, if anything.
One factor, I suspect, is a type of saturation. Those who discovered the essay early on and passed on the link to it have no reason to look at it again; nor do those to whom the link was sent. Maybe this quarter will show a trend of some sort.
October 2007 Update
Surge! The faked government numbers show an upward movement, despite the games the Bush cabal no doubt plays with them. SBOBU is shooting up. Hold on tight, everyone.
December 2007 Update
More surge. SBOBU is reflecting the grim times we all know are here. Even the fake Bush green line shows it.
You know, this SBOBU thing seems to actually work.
April 2008 Update
Odd oscillations from month to month, but the trend is clear. And dismal. Even the fake government numbers are heading steadily up.
October 2008 Update
Oops. Skipped a quarter. Well, it wasn't a happy quarter. The most recent quarter is even less happy.
I added a trendline to make the picture clearer, and it's apparent that my absurd, meaningless, made-up way of measuring unemployment is a reliable leading indicator that not only predicts where the Bureau of Labor Statistics number will go but also presents the true unemployment picture much more accurately than the shamefully-massaged-for-political-reasons BurLabStat number does. Not terribly surprising. Practically any index you invent is likely to be more reliable than the one foisted on the public by the weaselly and illegitimate Bush administration.
February 2010 Update
Golly. Skipped more than a year, this time. Well, I have some excuses. First, there was the excitement of the election and the victory for the relatively speaking good guy who would inevitably turn out to be not as good a guy as I had allowed myself to hope. But I always expect that, so I wasn't as disappointed as I would have been decades ago, when I was naively trusting.
Speaking of which, I naively trusted that I'd be able to stay in the job I had at the time I wrote the previous update. In May 2009, I learned how silly I was. So add me to that green line. All these months later, my personal unemployment rate is still 100%.
But the green line is dipping. And now that the Party of Evil, which still has the audacity to call itself the Party of Lincoln, no longer squats and leers and smirks in the White House, I'd like to think that the green line is a bit more reliable and less likely to be cynically manipulated. But perhaps that's my residual naivete showing. Interestingly, the SBOBU index, the red line, does still seem to be a fairly reliable leading indicator of the green one. The polynomial trend line should start showing a downward bend in coming months. I hope.
Consequences
For the sake of argument, let's imagine that the SBOBU Index comes to the attention of the world's economists and opinion makers. Worried by the trends it shows, they check this page every month for the newest numbers. A fair number of them, intrigued, click on the link to the original essay that started all of this. Some of them may do that because they're worried about their own jobs and are curious about the unemployment experience. (Here's a summary: it sucks.)
Now, this would mean that the number of hits on the essay would start to be artificially inflated. In turn, that would cause the SBOBU Index to show an alarming, although artificial, increase. And in turn, that would spread alarm through the economist-opinion-maker community, resulting in even more clicks, and thus an even steeper climb in the SBOBU Index! The panic would accelerate!
You can see where this heading. This feedback loop could, all by itself, and without real justification, lead to the collapse of the world's economic system..
The moral burden is enormous and even terrifying. Perhaps, as a responsible citizen, I shouldn't even publish this Web page.
Nah. What the heck.